
Deciphering Climate Clues from Wetlands
What do wetland scientists do?
An Article by Shayna Meinzinger

The AquaGHG Wetland Team
As part of the SOLUTIONSCAPES project, the AquaGHG Lab team, led by co-PI DelSontro at the University of Waterloo, is conducting research on greenhouse gas emissions from eight restored wetlands near the Lake Erie basin. Wetlands are hotspots of biogeochemical processes and carbon cycling, producing and emitting greenhouse gases. This article describes how the team monitors greenhouse gas dynamics and environmental drivers at a number of their research locations. To do so, they examine water chemistry and isotopes, hydrological parameters, and relevant greenhouse gas emission pathways.
The AquaGHG Lab team collects data on three major greenhouse gases: carbon dioxide, methane, and nitrous oxide. Because methane is one of the most potent greenhouse gases, the team wants to better understand its major emission pathways in restored wetlands.
Water Chemistry
Water chemistry provides insights into carbon storage, nutrient cycling, and overall water quality in restored wetlands. Understanding the relationships between water chemistry parameters and increased greenhouse gas emissions rates can help inform environmental efforts aimed at mitigating climate change.

The AquaGHG team uses a Van Dorn to collect water samples at depth in the wetlands (left), and Nalgene containers to collect surface water samples (right). Dark-coloured Nalgene containers protect the water samples from sun degradation.
Researchers collect multiple water samples from different locations in the wetland. They use a Van Dorn sampler to collect the samples at specific depths in the wetland. They are then analysed for dissolved carbon, oxygen and hydrogen isotopes, as well as nutrients such as phosphorus and nitrogen.

Sara Abate uses a YSI in the middle of the wetland.
Researchers use a multiparameter YSI Sonde to measure key water characteristics in the wetland such as water temperature, conductivity, dissolved oxygen, and pH.

The AquaGHG team takes a Secchi disk measurement in the middle of the wetland.
Researchers use Secchi disks to better understand water quality. We lower the black and white Secchi disk into the water until it disappears from view; this is the depth that gets recorded. The shallower the Secchi depth, the higher the turbidity and suspended material in the water column. Higher turbidity in these wetlands often suggests eutrophication, which is caused by elevated levels of nutrients in the wetland that results in an overgrowth of algae.
Hydrological Parameters
Hydrological parameters, including perimeter inundation (i.e., extent of flooded area), soil moisture content, and groundwater levels help researchers understand the hydrology of a region. The AquaGHG team is investigating how these parameters relate to greenhouse gas fluxes, providing insights into how climate change might influence emissions of greenhouse gases.
We use GPS measurements to track changes in the wetland saturation perimeter and water levels.
Data loggers are installed at each of the restored wetlands to continuously monitor water level and barometric pressure. The loggers record a measurement every hour.

Anisha Karkera takes a GPS walk-around of the perimeter of the wetland.


(Left) The AquaGHG team installs data loggers at the wetlands. (Center and Right) Cooper Pickering collects soil cores via soil augering.
Soil cores are collected at the wetlands through soil augering. The soil auger is malleted into the ground and then extracted, providing the team with a soil core. The core is evaluated and information on depth, grain size, texture, water content, and any other identifying features is logged. Grains are collected as grain sizes change in the core to determine general lithology at the wetlands.
Gas Emissions
To measure diffusive greenhouse gas emissions, researchers use a floating chamber connected to a greenhouse gas analyzer. Our team has two greenhouse gas analysers: a Picarro for measuring methane and carbon dioxide flux, and a LI-COR for measuring nitrous oxide flux in the wetland. The chamber, placed on the water's surface, tracks gas concentration changes over time. If the concentration increases in the chamber, it indicates the wetland is emitting greenhouse gases. Flux is calculated from the slope of the concentration increase (or decrease) over time.

Mackenzie Sluys placing a floating chamber on the wetland surface connected to a Picarro analyser to measure diffusive methane and carbon dioxide flux.


The AquaGHG team collecting a dissolved gas sample via the headspace technique.
To get dissolved gas samples, we use the headspace equilibration technique. A 100 mL water sample is drawn into a syringe, followed by the addition of 40 mL of nitrogen gas. The syringe is agitated for 2 minutes to allow the gases to become equal between the water and the headspace. The headspace gas is then extracted and analysed, which allows us to calculate the initial concentration of gases in the original water sample.

Shayna Meinzinger sets up a funnel transect to collect ebullition emissions over 24 hours.

Shayna Meinzinger sets up a funnel transect to collect ebullition emissions over 24 hours.
The AquaGHG team uses novel techniques that analyse one particular pathway of methane release called ebullition. Ebullition emissions, which are not widely studied, are important to understand because they are typically more concentrated and bypass oxidation processes that help minimise methane concentrations, providing a direct pathway to the atmosphere.
Ebullitive emissions are collected using floating funnels submerged in the wetland. The floating funnels are attached to a transect that crosses the deepest part of the wetland. As bubbles rise from the wetland’s sediment, they are trapped in the floating funnels. The trapped gas is collected and analyzed for methane and carbon dioxide, along with the carbon and hydrogen isotopes of these gases.
Another innovative method for collecting ebullitive emissions is known as bubble tapping. In this case, the team manually disturbs the wetland sediment and collects the rising bubbles in a funnel. The gas is then transferred into a syringe and then into a vial. It is then analyzed in the same way as the above technique. Next, researchers add the measurements to a bubble model to estimate the ebullitive flux.
Bubble tapping is conducted at the wetland inlet, utilizing a bubble tapping funnel (pictured above). The video pictures ebullition emissions rising to the wetland’s surface after agitation of the sediment below.
A sediment chamber is used to determine the dry flux of the soil along the edges of each wetland. Methane, carbon dioxide, nitrous oxide, and water are measured. The AquaGHG team uses a soil moisture probe to measure the volumetric water content, pore water conductivity, and soil temperature at the wetlands. Soil is collected from each site to create a calibration curve for more accurate readings.
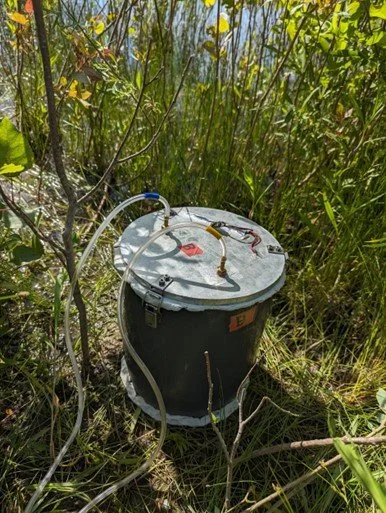
Dry flux chamber attached to a greenhouse gas analyzer measuring soil flux.
From Fieldwork to Research Impact
As wetland scientists, we’re lucky to be able to spend time in the field collecting data on greenhouse gas dynamics using the different techniques described above. This provides valuable data to study the cycling of methane and other greenhouse gases in restored wetlands. Such understanding is necessary to better predict the impact of restored wetlands on climate change and to also guide efforts to manage, preserve and restore these critical ecosystems.
Acknowledgements
This research contributes to the SOLUTIONSCAPES project and is funded by a Natural Sciences and Engineering Research Council of Canada (NSERC) Alliance and Mitacs grant (‘Designing Climate and Water Smart Wetland Restoration Scenarios for Canada’s Agricultural Landscapes’) with PI Nandita Basu, co-PI Tonya DelSontro and collaborators, Pascal Badiou and Bryan Page from Ducks Unlimited Canada.